-
Scheduling Schedule your posts on your social networks
-
Team management Collaborate with your team
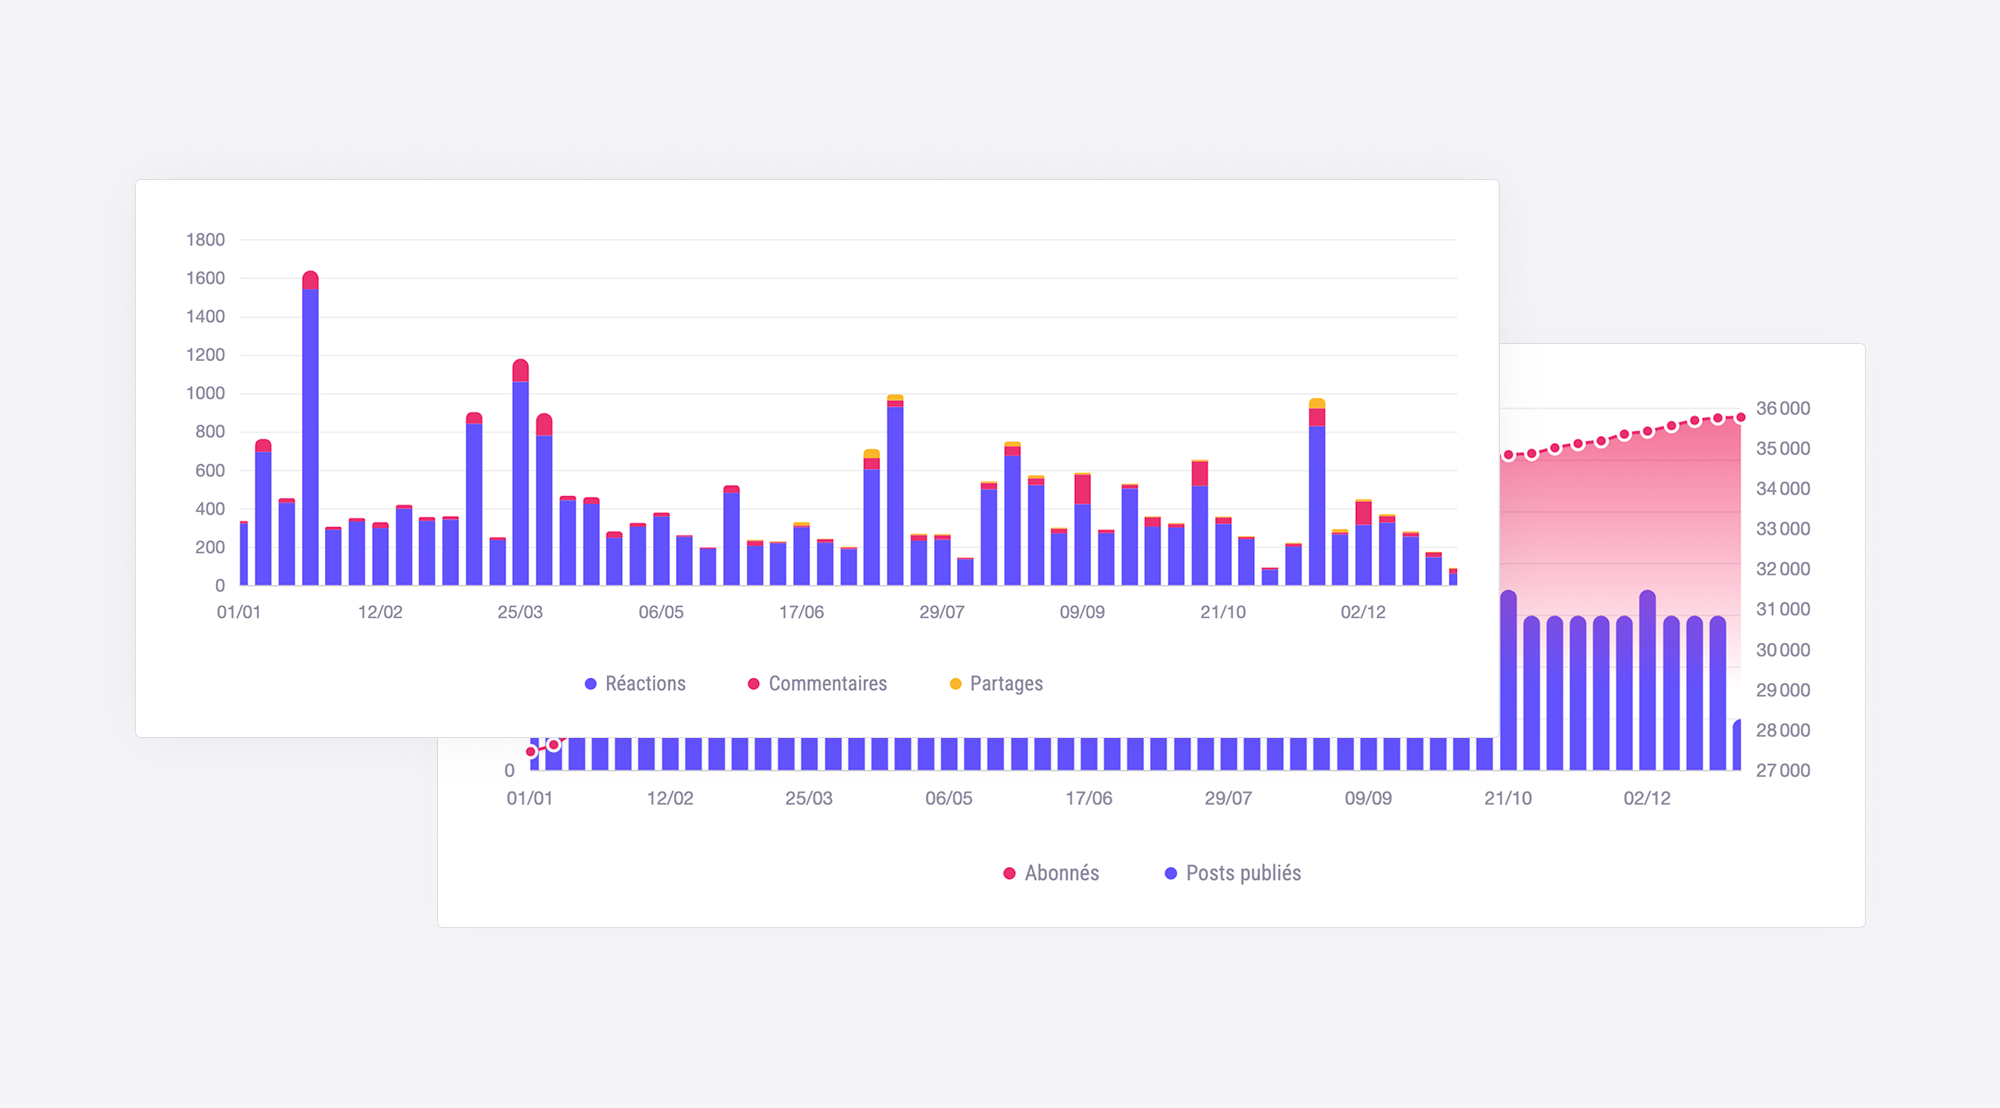
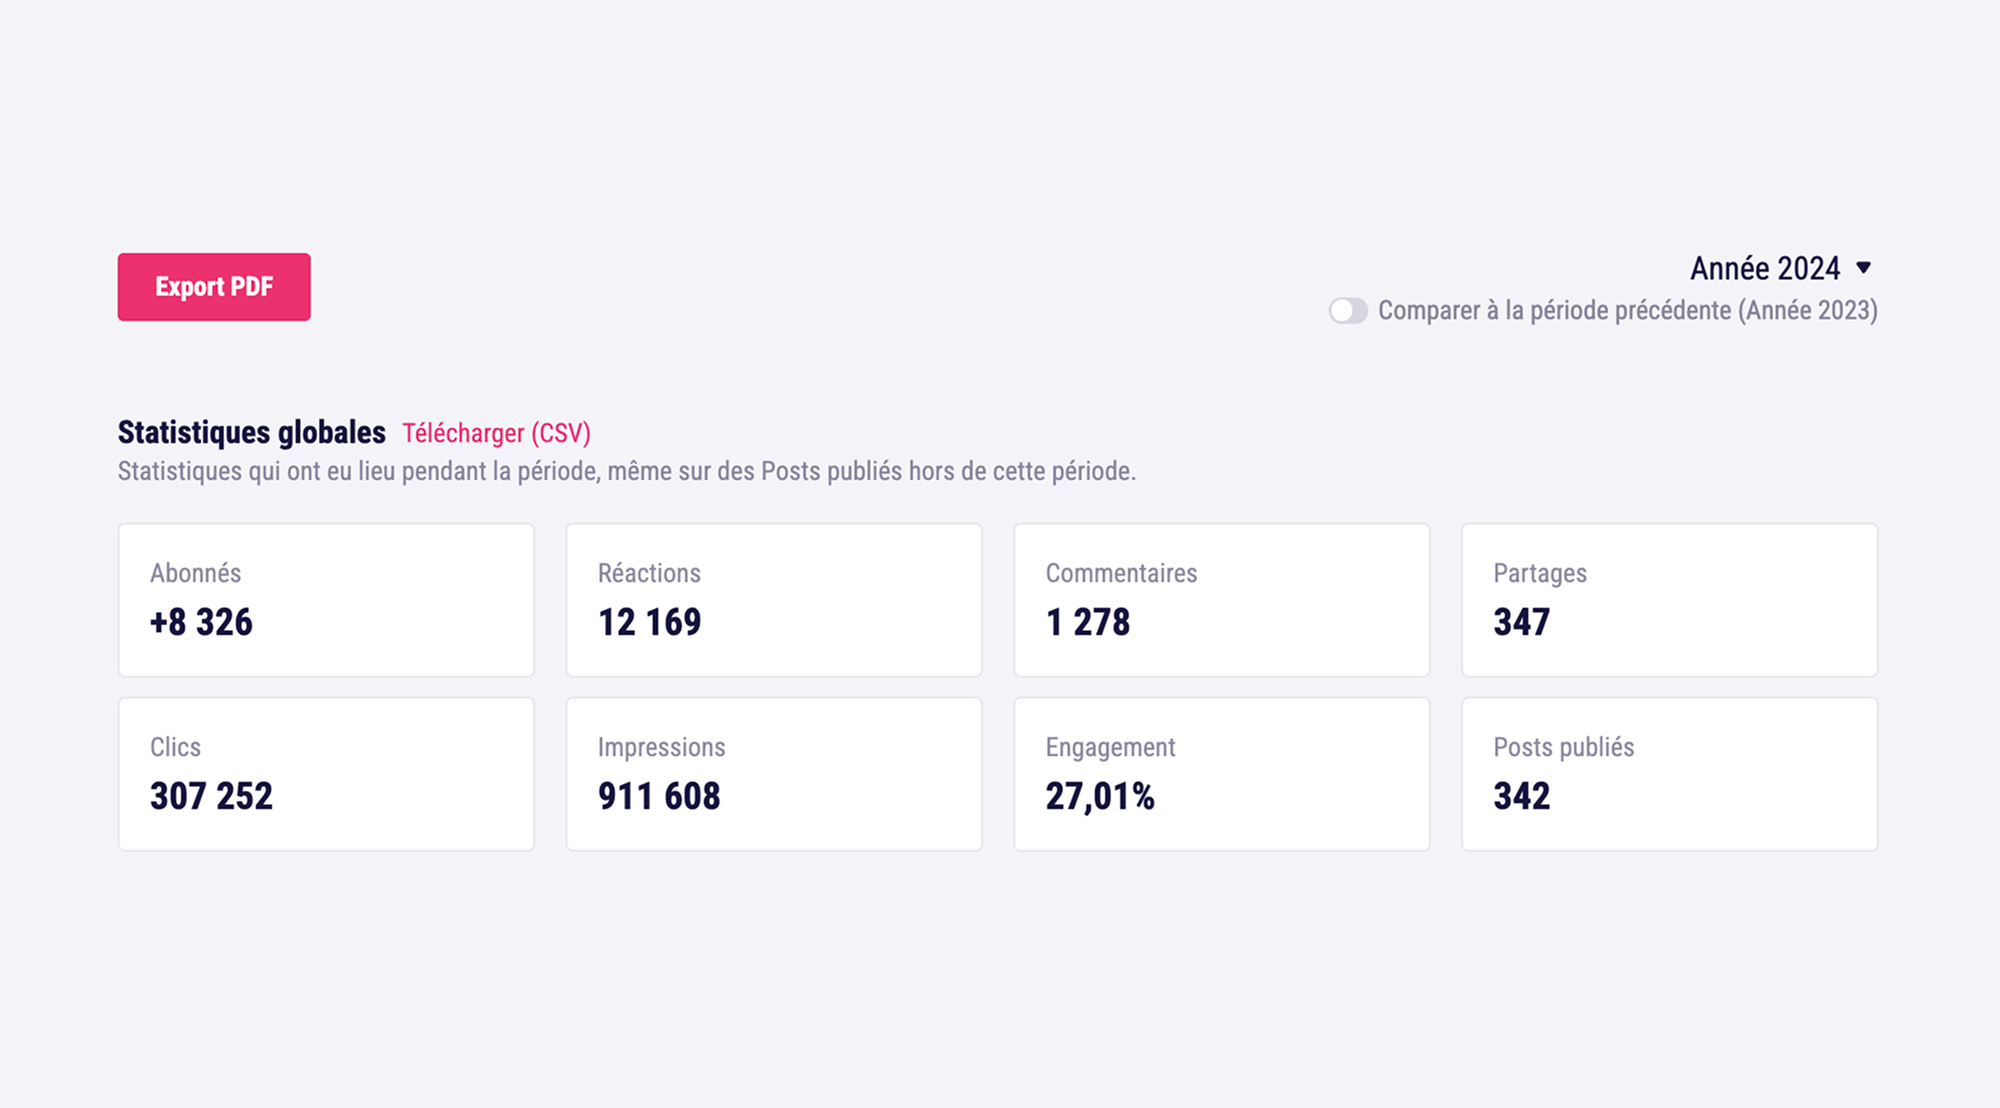
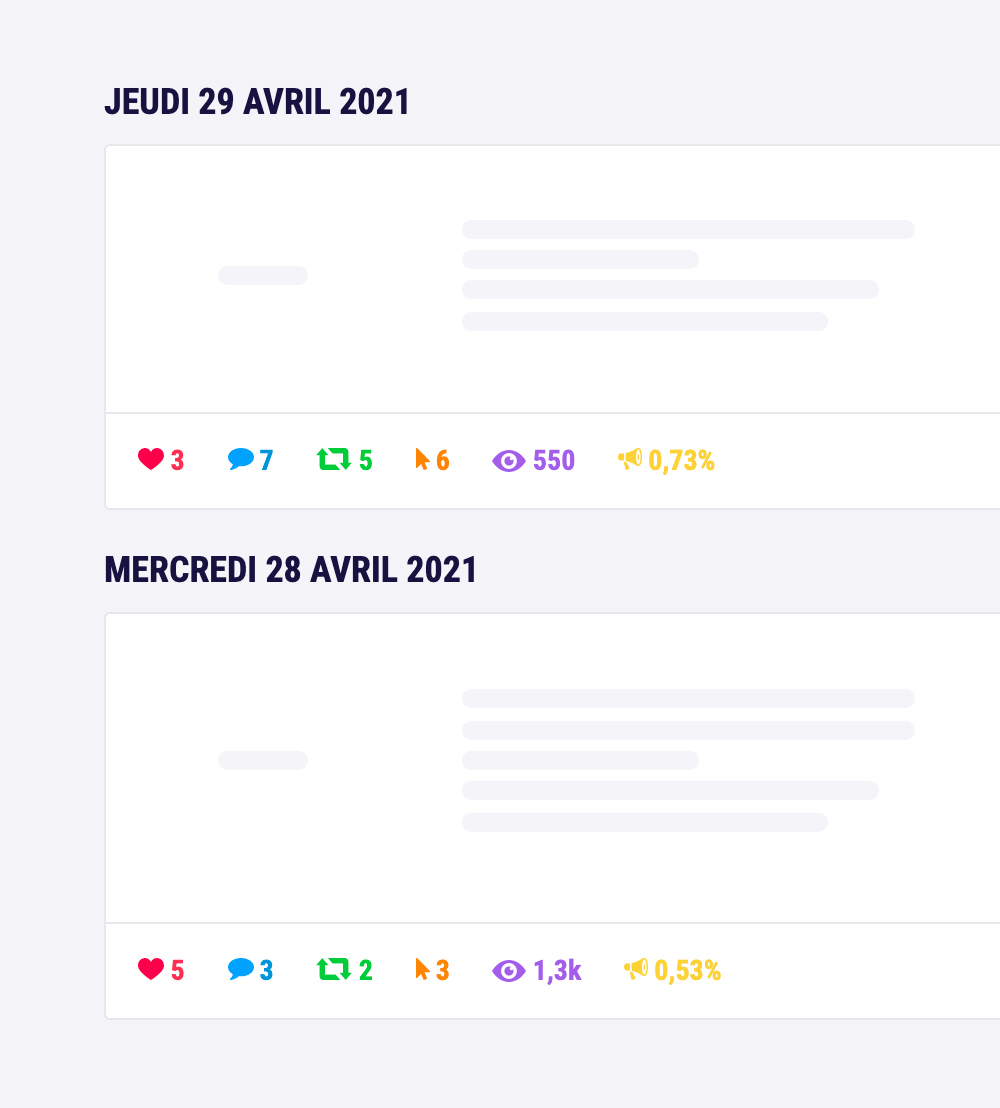
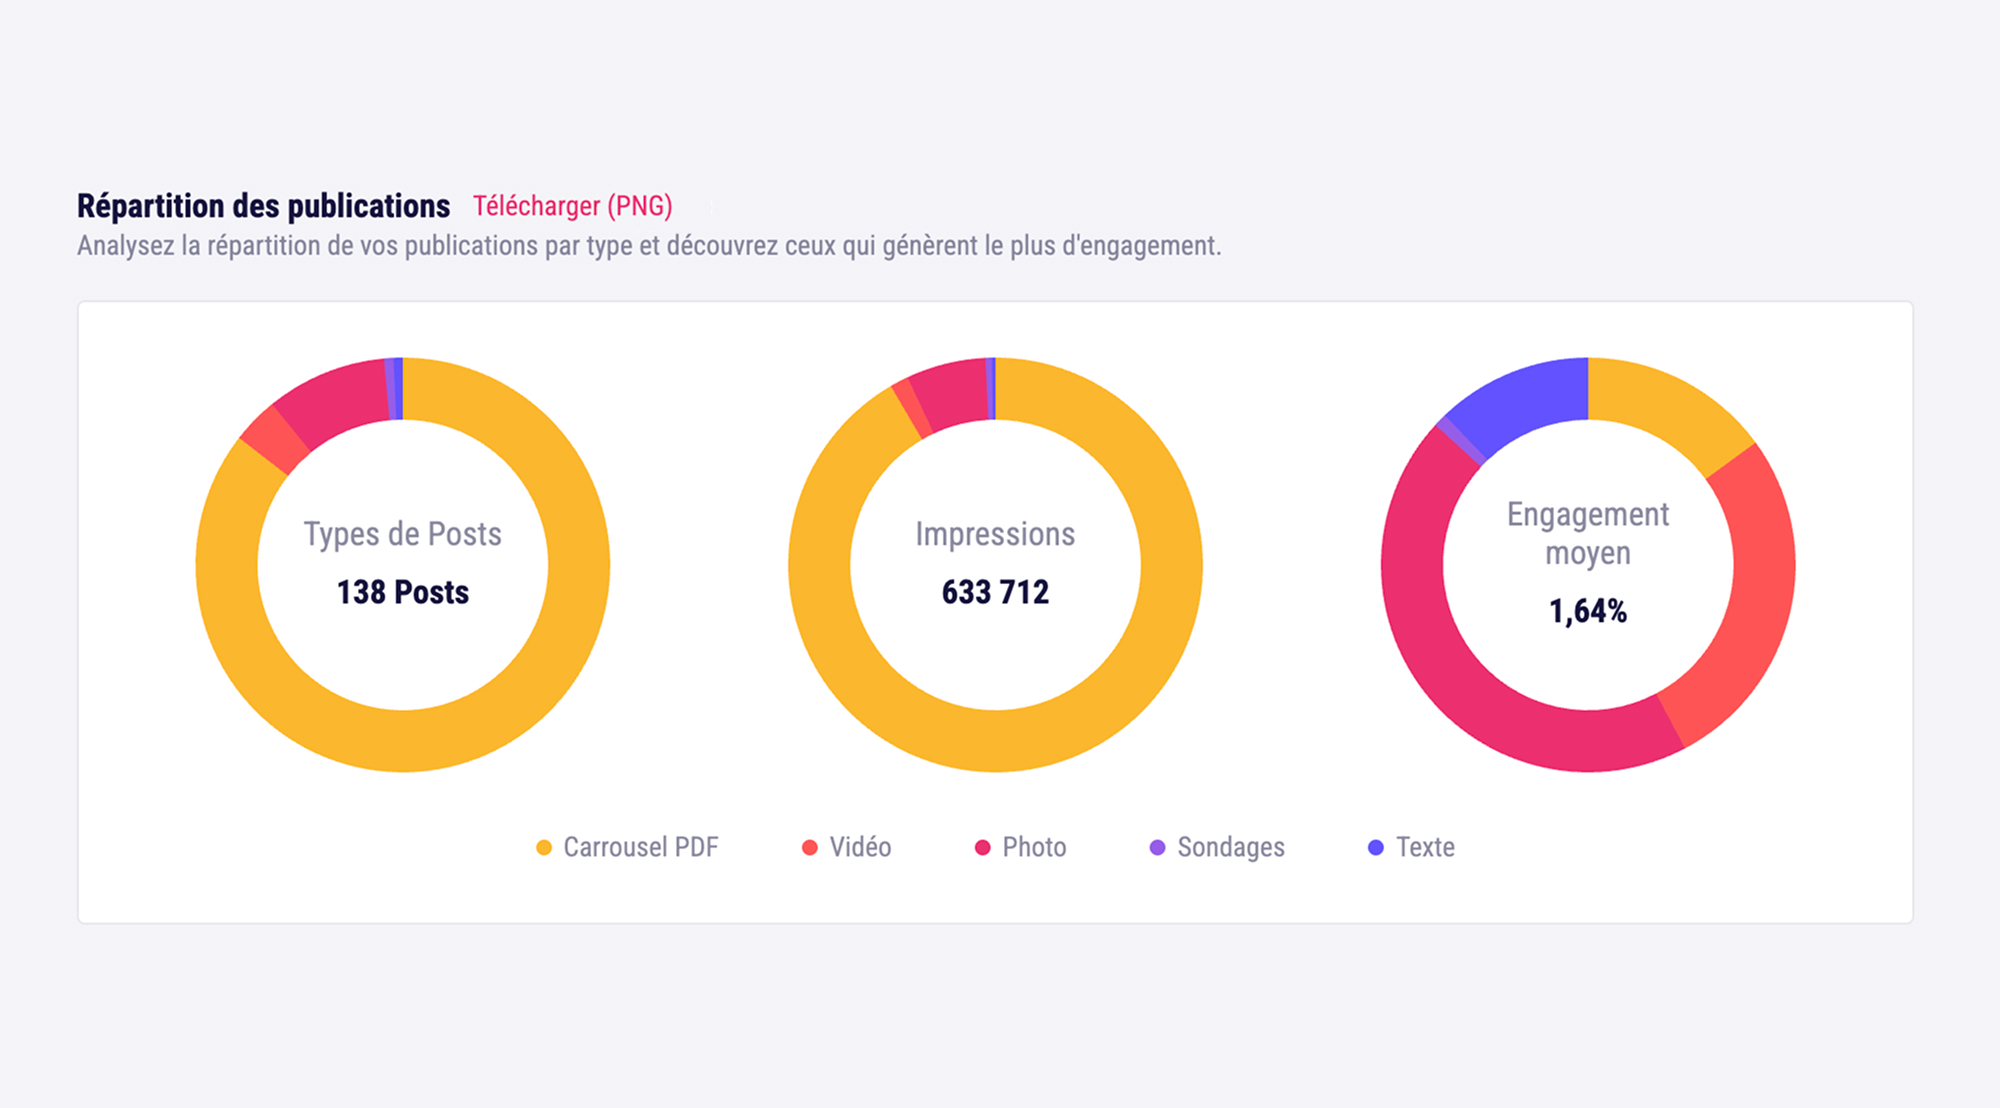
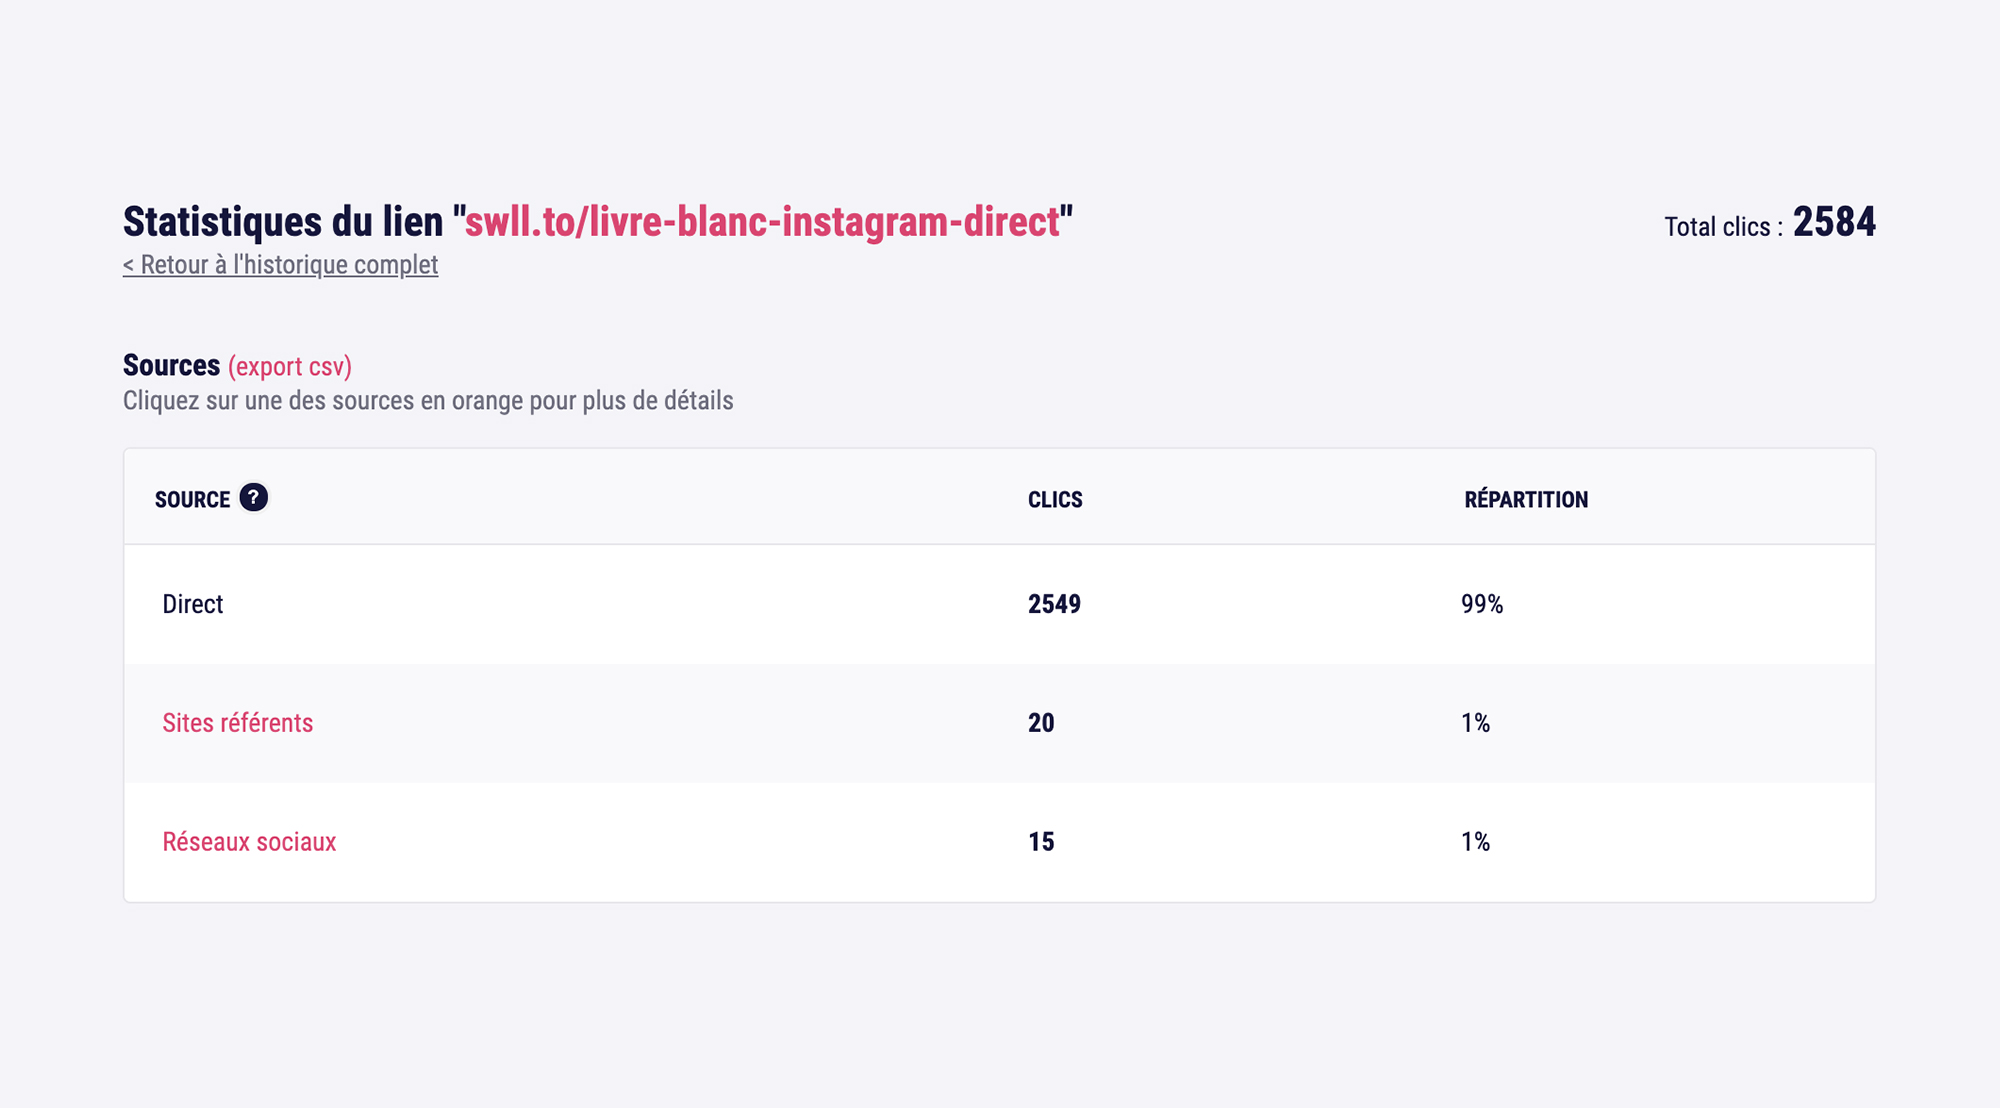
- Analysis Track and export your statistics
-
Monitoring Dashboard Stay informed about news in your industry
-
Inbox Manage all your comments
- Comment management (soon)
- Private message management (soon)
- Scheduling
- Team management
- Overall Statistics
- Simultaneous scheduling
- Recurring scheduling
- Duplicate Posts
- Social Media Calendar
- Posts preview
- Shared library
- Artificial Intelligence
- Top/Flop 10 Posts
- Hashtags suggestion
- Link shortener
- Image editor
- Profiles Grouping
- Quality Coach
- Mentions & auto-completion
- Best times to post
- Suggested GIFs & Images
- Mobile Applications
